IRI, a provider of innovative solutions and services for consumer, retail and media companies, announced the addition of the IRI CPG Supply Index to its online COVID-19 Info Portal and Data Dashboard. According to the press release:
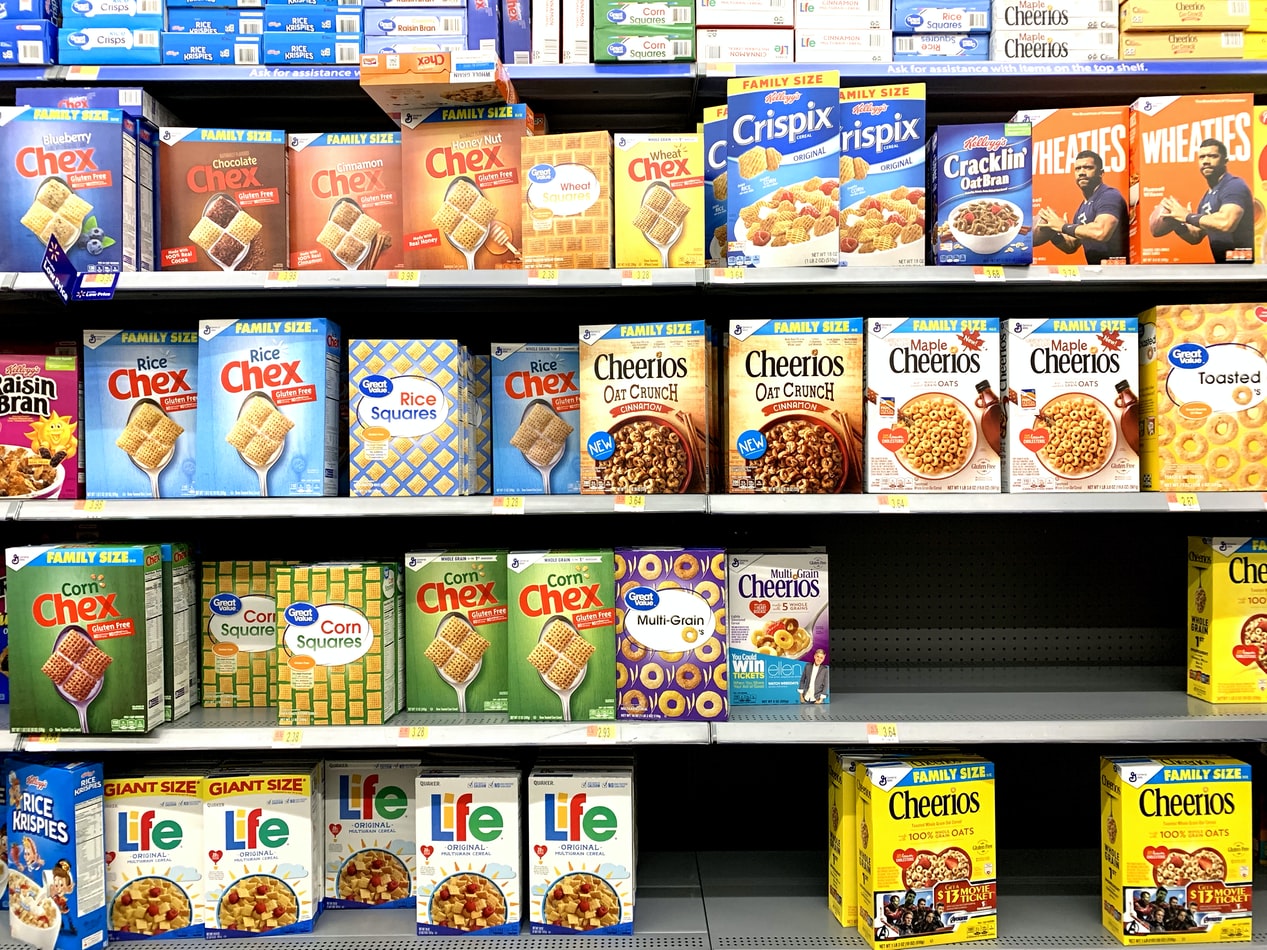
COVID-19 is disrupting supply chains across the globe, which has made it extremely difficult for CPG businesses to track product availability metrics such as in-stock rates and is creating unprecedented local variation within each country,” said Andrew Appel, president and chief executive officer of IRI. “Our new CPG Supply Index provides insight into which products are making it to stores’ shelves and at what levels. This comprehensive solution uses IRI’s refined proprietary algorithms to model in-stock rates both in absolute terms and against measurements taken just before the COVID disruption — giving CPG retailers and manufacturers a holistic picture of how consumers experience out-of-stock issues.
Other CPG (Consumer Packaged Goods) Economic Indicator tools, powered by IRI Liquid Data®, that track consumer product demand and supply during the pandemic via the COVID-19 Info Portal include:
- The IRI CPG Demand Index provides a standard metric for tracking changes in spending on consumer packaged goods. It measures weekly changes in consumer purchases, by dollar sales, against the year-ago period across departments including fixed and random weight products, grocery aisles and retail formats.
- The IRI CPG Inflation Tracker provides the well-known price per unit metric for tracking changes in pricing of consumer packaged goods. It provides weekly changes in consumer prices, price per unit against the year-ago period across departments including fixed and random weight products, grocery aisles and retail formats.
- Market Map indicating Out-of-Stock Levels for Top-Selling Subcategories by Market Area in the U.S. You can click on a market in the map to see last 4 weeks trend.
- Top U.S. Product Growth Categories – Charts represent week over week sales growth in shown fast moving categories.
Photo by Franki Chamaki on Unsplash

